Link a Chart and a Pivot Grid
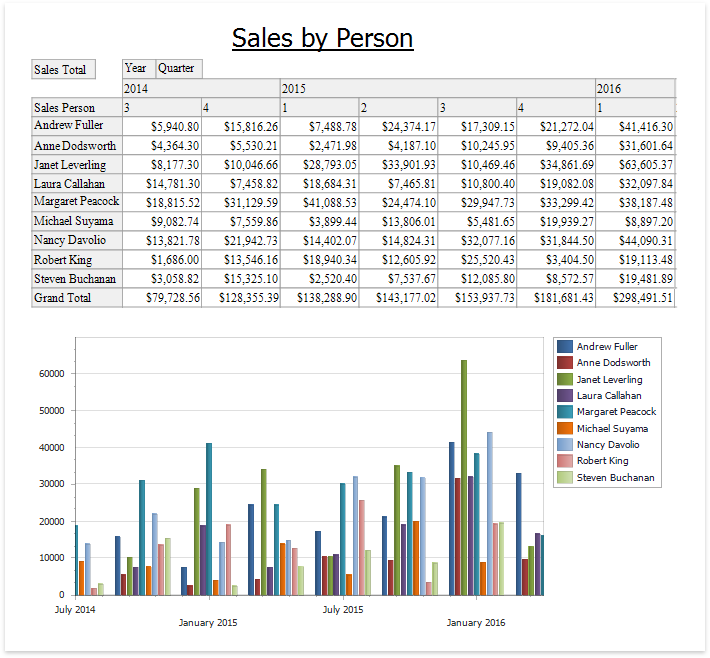
This tutorial demonstrates how to use the Chart control to visualize the Pivot Grid control's data.
Create a Pivot Grid
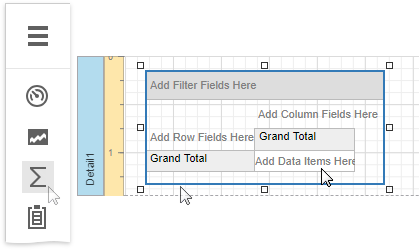
Drop the Pivot Grid control from the Toolbox onto the Detail band.
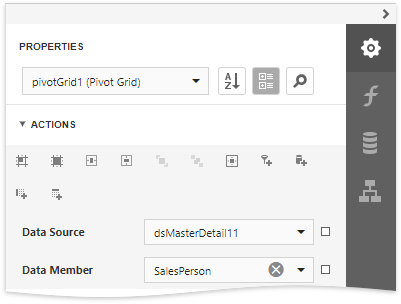
Specify the Data Source and Data Member properties to bind the Pivot Grid to data.
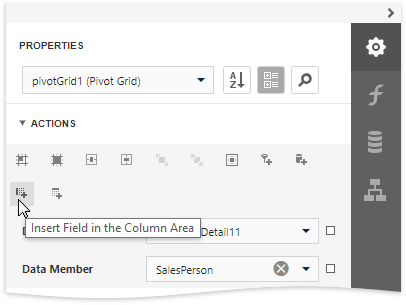
Insert fields in the Filter, Data, Column and Row areas to define the Pivot Grid's layout. Select the corresponding command in the Actions category.
Alternatively, select the Pivot Grid, expand the Fields node in the Data category to manage the control's fields and access their properties.
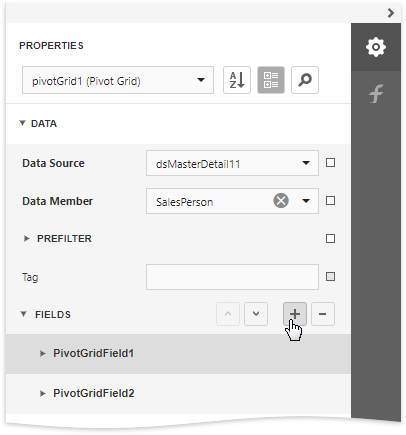
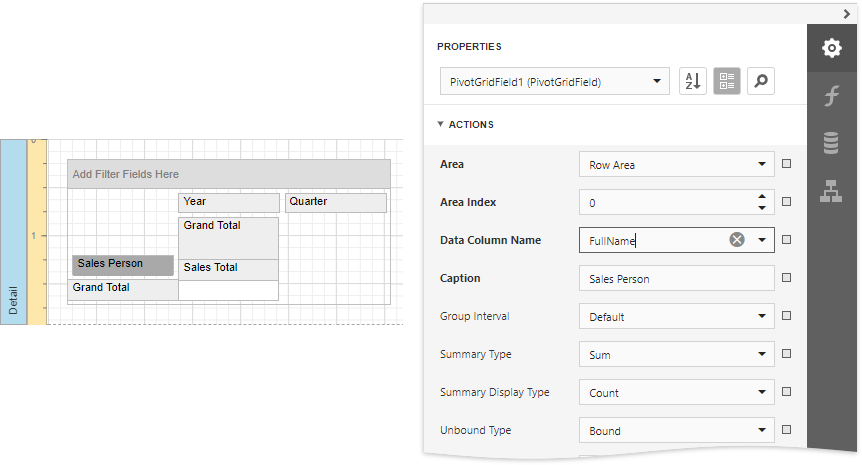
Select the Pivot Grid's field and specify its Data Column Name property to bind it to data.
Link a Chart with the Pivot grid
Drop the Chart control from the Toolbox onto the Detail band below the Pivot Grid.
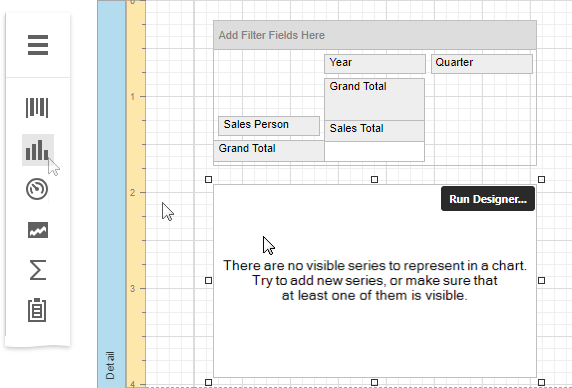
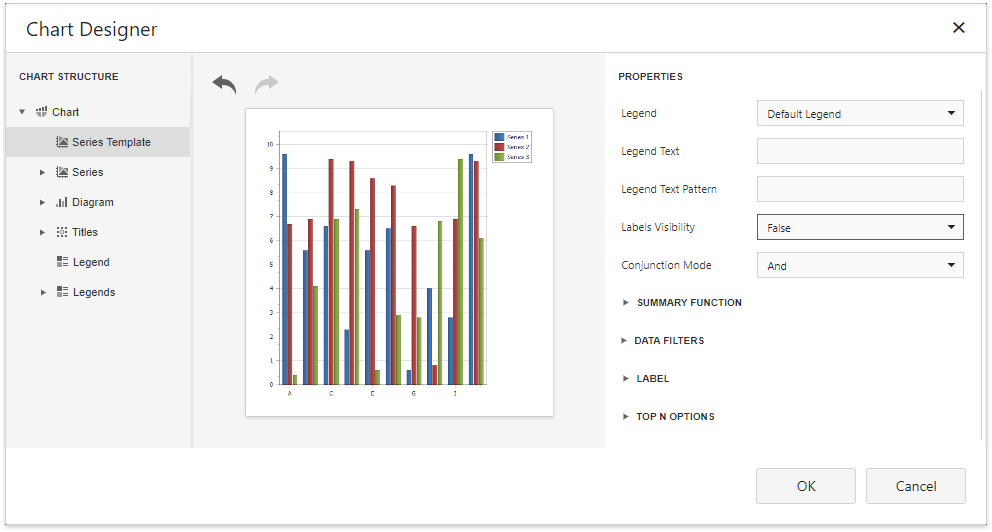
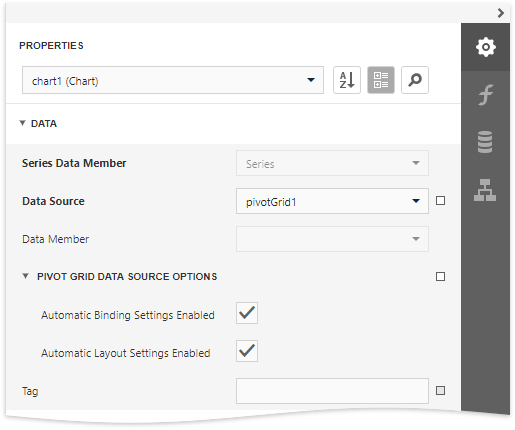
Click Run Designer to invoke the Chart Designer. Choose the Pivot Grid in the Data Source property's drop-down list.
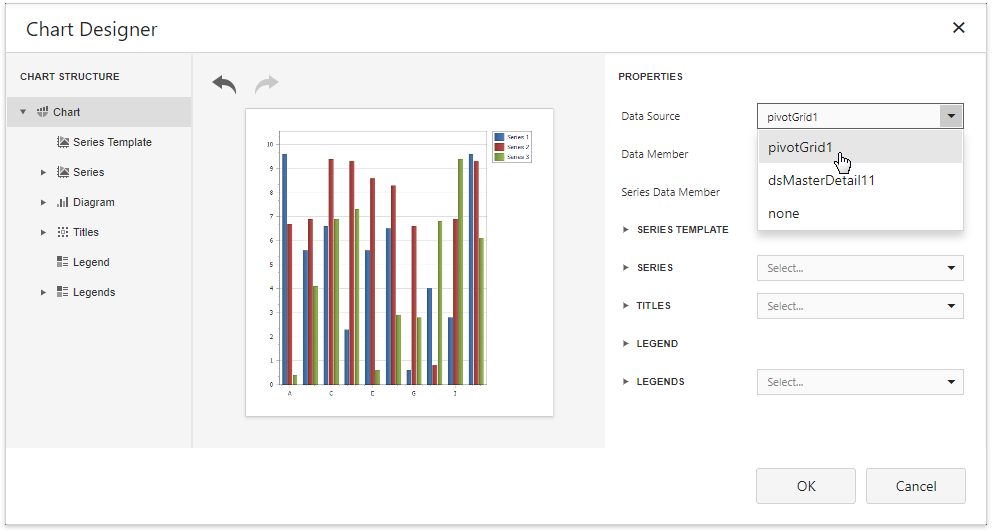
Select the Series Template node in the chart elements tree and disable the Labels Visibility check box to avoid overlapping series labels.
(optionally) You can customize various settings that determine a linked Chart and Pivot Grid pair's common behavior. To do this, use the Chart's Pivot Grid Data Source Options property. This property is synchronized with the Pivot Grid's Options Chart Data Source property.
View the Result
Switch to Print Preview to see the resulting report.